
The Technical Capability of headphones - Part 1

There’s a common claim made by many professional audiophile reviewers that headphone characteristics are determined by two criteria: 1) tonality and 2) ‘technicality’, with tonality being uniquely determined by amplitude versus frequency and technicality being essentially independent and subjective. There now seems to be a pervasive acceptance in many online forums that technical capability is something that can’t (ever) be measured, and can only be known by smashing those ‘like’ and ‘subscribe’ buttons and deferring to the opinions of the superior golden-eared reviewer.
While HypetheSonics considers amplitude versus frequency to be the leading-order effect of headphone preference, this miniHype aims to demonstrate that those measurements alone can’t tell the whole story. One obvious nuance arises from the impedance variation of certain headphones, which can cause a very audible shift in frequency response with different sources. This effect can’t be determined without knowing both the output impedance of the source and the impedance curve of the headphone. However, its primary effect is a shift in tonality and therefore not necessarily something that directly affects the elusive beast that is ‘technical capability’.
It’s widely accepted that equalizing one headphone to match another doesn’t always produce an audibly-indistinguishable experience. One issue here is, of course, that it’s extremely difficult to perfectly equalize one headphone to another, and even if achieved, equalization is usually only a perfect match in SPL, and only then for someone whose ear impedance and geometry exactly matches that of the ear simulator used in the measurement – a rather unlikely scenario given the variance in human anatomy. A second issue is that even if that equalization perfectly matches amplitude versus frequency in the actual human ear, phase, distortion and transient-response can still differ.
Many of these same subjective audio reviews are quick to dismiss time-domain measurements, yet recovering an arbitrary signal in the frequency domain (through an inverse Fourier or Laplace transform) requires knowledge of amplitude, frequency and phase. Throwing away the phase (as is typically done when presenting SPL graphs alone) means we cannot reproduce time domain effects like impulse response. Attack and timbre are the two most critical components that our brains use to identify musical instruments. A sharp attack, such as that of a piano or castanets, tends to sound soft and less-easily distinguished when those transients get fuzzy or smeared. A headphone’s ability to respond to sharp transients can’t always be accurately inferred from its amplitude versus frequency graph. As an example, consider the following two headphones, which have very similar frequency responses:
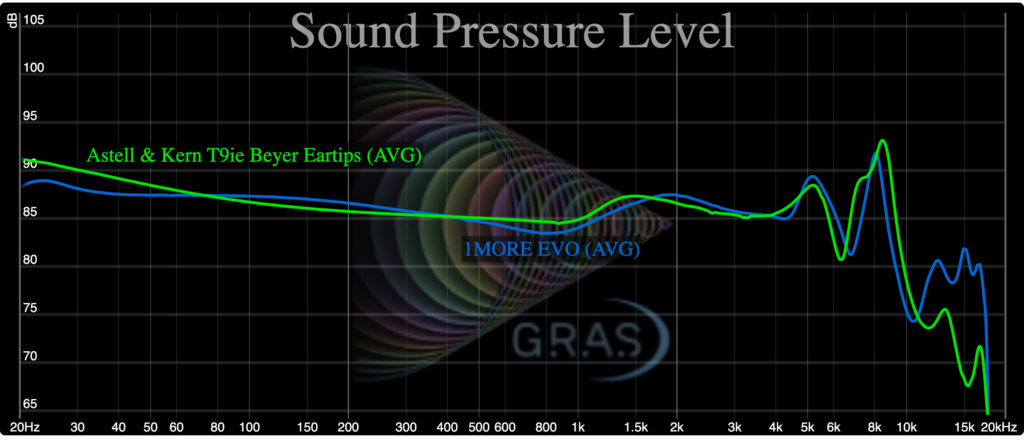
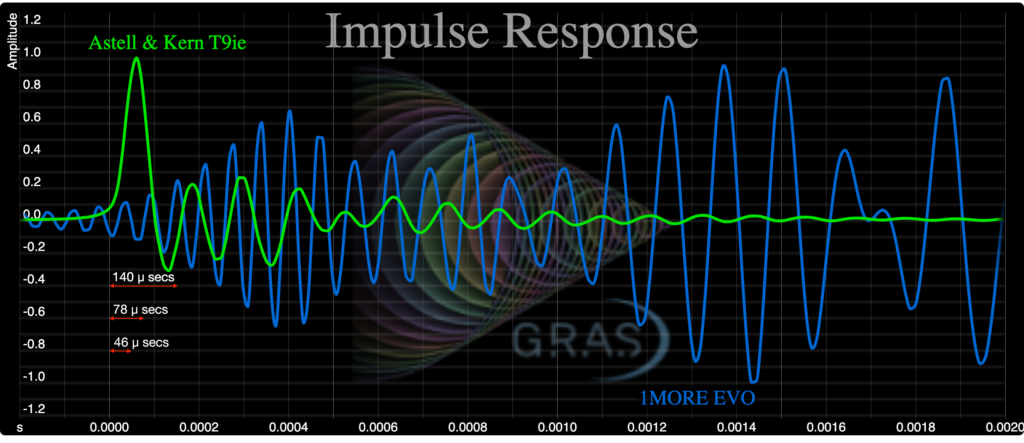
If your ears were a good match for this GRAS ear simulator, you might expect these two headphones to sound quite similar. Yet their response to an impulse is very different:
The most dramatic extrapolation of this would be to consider signal A as an impulse (zero phase for all frequencies) and signal B as a periodic section of white noise (random phase for each frequency). Both A and B could have identically flat SPL graphs, but would obviously look very different in the time domain, and would sound dramatically different to your ears.
But can you really hear timing differences as small as those shown on the x axis above? Let’s try it. Find yourself a quiet environment in which to listen undisturbed and grab a pair of wired headphones. Electrostatic headphones would be ideal, but a good (preferably single) balanced-armature or dynamic-driver IEM should also work.
The following test tracks were originally posted on a HydrogenAudio forum and supply a single impulse (or click) separating the left and right channels by varying intervals of time, in microseconds. These tracks can also be downloaded in FLAC format for offline statistical testing:
Impulse Test
- Reference track - single synchronized click
- delta = 140.6 microseconds
- delta = 78 microseconds
- delta = 46.85 microseconds
- delta = 36.4 microseconds
- delta = 26 microseconds
- delta = 20.8 microseconds
- delta = 15.6 microseconds
- delta = 10.4 microseconds
The reference comparison track is zero separation, i.e., a single synchronized click. The largest separation (provided as an easy test to get you started) is ~140 microseconds, a wavelength which would correspond to a frequency of about 7 kHz. The smallest separation given above is about 10 microseconds, corresponding to a frequency of 100 kHz, which is far beyond the threshold of human hearing. One fascinating aspect of this test is that even if you can’t perceive the 10 microsecond separation, you should be able to perceive a separation down to a delta_t whose corresponding Nyquist frequency is above your personal upper-frequency threshold of hearing. Even if you only get as low as 46 microseconds (~22 kHz), this is still a tiny fraction of the 5000 microsecond ringing duration of the 1MORE EVO’s impulse response, and smaller than the decay time, and smaller even than the rise/fall time for most IEMs. (The fastest rise/fall time we’ve ever measured for an IEM is around 100 microseconds.) For reference, the delta_t intervals for the first (easiest) three test tracks are shown in the above impulse graph. All are extremely small in comparison to the total time of the impulse response and the ringing of the EVO headphone. As with most listening tests, a trained listener will tend to perform better here than a novice. That can be a curse with many audio-related aberrations, as once you’re aware that there’s an audible error it becomes almost impossible to disregard it. It is, however, important not to confuse perception with preference. You probably wouldn’t care if the guitarist moved two yards to the left during a concert, but smeared transients or non-constant timing errors can muddy spatial perception. On their own, neither of these issues might be enough to drive a strong preference for a given headphone, but the fact that humans are able to perceive such small timing differences suggests it would be unwise for OEMs to assume such effects can always be neglected.
Let’s look at another subtlety – distortion. Harmonic distortion occurs naturally in musical instruments, so some additional tweaking to the harmonic distortion components needn’t sound unpleasant (many people love tube amplifiers), but it nevertheless represents an error in the signal reproduction and if the goal is transparency then we shouldn’t want any audible distortion. An argument sometimes offered against distortion measurements is that most of us are not driving in-ear monitors to the point of non-linear driver breakdown, so unless there’s something really egregiously wrong with the headphone, levels of distortion are so low in modern headphones that we can simply ignore them.
Many IEMs have impressively-low levels of harmonic distortion where the previous statement is almost certainly true. For example, the beryllium dynamic driver in the Periodic Audio Be has, at certain volumes, distortion levels of around 1/100th of 1 percent. However, there are other types of driver such as balanced armature (BA) which have consistently different, and consistently higher, harmonic distortion characteristics, usually dominated by odd-order harmonics. Being small and inexpensive, BA drivers are widely used in IEMs – often with multiple BA drivers packed into a single IEM. Distortion levels, relative to the fundamental, typically increase with volume and in BA-based headphones can easily reach 1 or 2% over certain parts of the spectrum. This is more than 100 times the distortion levels in the Periodic Audio Be. But even a 2% distortion level implies that the harmonic sits 34 dB below the fundamental. Can you really hear that? Or would it bother you if you did?
The answer isn’t black and white, because audibility depends on the type of headphone, background noise, driving signal, distortion characteristics, the masking effects the input signal might have on the distortion, as well as individual perception and psychology – what is barely audible to some may be a deal-breaker to others. Let’s try another example. Grab a good pair of headphones (ideally a pair of single-driver dynamic or planar magnetic IEMs, because to conduct this test fairly you’d want something that doesn’t produce a lot of third-order harmonics of its own) and have a listen. The following tracks can also be downloaded in WAV, FLAC, or variable bit-rate MP3 format for offline statistical listening tests:
Harmonic Distortion Test
- Reference track - single 400 Hz sine wave
- 400 Hz sine wave + 4% 3rd order harmonic distortion (+ 1200 Hz @ -28dBFS)
- 400 Hz sine wave + 2% 3rd order harmonic distortion (+ 1200 Hz @ -34dBFS)
- 400 Hz sine wave + 1% 3rd order harmonic distortion (+ 1200 Hz @ -40dBFS)
- 400 Hz sine wave + 0.5% 3rd order harmonic distortion (+ 1200 Hz @ -46dBFS)
- 400 Hz sine wave + 0.25% 3rd order harmonic distortion (+ 1200 Hz @ -52dBFS)
- 400 Hz sine wave + 0.2% 3rd order harmonic distortion (+ 1200 Hz @ -54dBFS)
- 400 Hz sine wave + 0.1% 3rd order harmonic distortion (+ 1200 Hz @ -60dBFS)
The reference comparison track is a pure 400 Hz sine wave. The second signal adds 4% third-order harmonic distortion and is just included to get you started so that you know what to listen for. This one should be obvious to your Grandma. Work your way down and see how low you can go. Given the right pair of headphones and a quiet listening environment, some of you should be able to hear the presence of the third harmonic even in the last of these tests, but most should find that 1% or even 0.5% distortion is easily audible. Would real music mask this effect? Perhaps. But it’s not for us to dictate what somebody else calls ‘real music’, and it would obviously be preferable not to have to rely on masking effects and psychoacoustics to sweep these errors under the carpet. Playing music at 100 dB, a 0.1% distortion ends up 60 dB below the fundamental, i.e., 40 dB, which is roughly the level of normal conversation. If we had a 0.001% (-100 dBFS) level of distortion at this same volume level, this would result in a 0 dB distortion amplitude, which would guarantee the distortion to always be completely inaudible without needing to rely on the pot-luck of masking effects. We don’t claim that any of the above levels of distortion would cause the bulk of the population to dislike a particular headphone – the masses are not that discerning, and even if they were it wouldn’t make distortion a leading-order effect on preference. However, all other things being equal, it could end up acting as a tie-breaker. Distortion that is obviously audible in some test scenario is enough to risk it being audible during actual music playback and this makes its measurement relevant and intrinsically interesting. The only safe solution in headphone design is to ensure distortion levels are sufficiently low that their audibility – in any situation – wouldn’t even be up for debate anymore. At modest (e.g., 70 dB) listening volumes, headphones such as the Beyerdynamic Xelento can already achieve this.
The prevalence of high levels of third-order harmonic distortion in balanced-armature drivers, along with their natural tendency to struggle with the generation of low frequencies and their greater sensitivity to seal-leakage effects can sometimes contribute to giving BA-based headphones a slightly lean and unnatural bass timbre, even if/when their frequency response graph appears to essentially match those of planar magnetic or dynamic driver IEMs. BA-based headphones also tend to suffer disproportionately from strong impedance variation with frequency. Despite these many reasons to avoid using BA drivers, there are some good reasons for OEMs to stick with them – use of multiple BA drivers can sometimes make a headphone easier to tune, they can give a bigger dynamic range, and they’re cheap and can offer larger profit margins.
While a frequency-response graph typically covers the entire audible spectrum in a snapshot, actual music is comprised of a series of transients that contain only a limited subset of those frequencies at any given instant. A conventional FR graph couldn’t show even the largest of the distortion levels considered above. Being generous and considering a healthy 5% level of distortion, we can sum an 80 dB and a 54 dB signal (5% of the fundamental amplitude) resulting in, even assuming perfect constructive interference, an increment of only 0.02 dB (continuing our generosity by rounding up to 2 decimal places). This very-audible effect would be completely imperceptible to the eye on any FR graph.
Most professional audiophile reviewers would never publicly admit that they couldn’t clearly hear the differences between one DAP and another, or between CD quality and hi-res audio. Yet the errors discussed above in terms of impulse response and harmonic distortion are far more significant than any errors in modern DAPs, or from any error resulting from only using a ‘low-res’ 44 kHz sample-rate. The real problem with the timing/phase and harmonic distortion errors discussed above is that they’re only the tip of the iceberg. There is, unfortunately, potential for much more easily-audible errors in actual music playback. Past attempts to address this have resulted in what we would term ‘traditional’ audio metrics, and are typically determined using test signals such as single sine waves, dual sine waves (testing for intermodulation distortion), square waves (testing frequencies up to Nyquist), triangle waves, full-spectrum white or pink noise, or program simulation noise, such as IEC 60268-1. Results are often presented as a single number, such as SINAD, which provides the ratio of the true signal amplitude to all sources of noise and distortion. It is important and relevant that SINAD include more than just harmonic distortion effects, because the inclusion of DACs and amps in modern Bluetooth headphones means all manner of distortions and errors could apply directly to headphone measurements.
We have nothing against SINAD in its literal definition, but we question what tests are routinely used to define it. One of the most interesting and potentially relevant pieces of audio research in recent years is the development around the df-metric or histogram-median error by soundexpert.org. The significance is not so much the metric itself, but rather the work that has been done in highlighting how the accuracy of modern DACs and amplifiers varies so substantially with different input waveforms. A 1 kHz sinusoid has, unfortunately, become the de facto standard audio test signal, but much like the VW automobile tail-pipe emissions test, it has very little correlation with real-world performance. More complex waveforms (for example, actual music tracks) result in substantially higher errors, and the same is almost certainly true of every electro-mechanical system, including loudspeakers and headphones. The presence of sharp transients superimposed on lower-frequency waveforms causes a general detriment to reproduction accuracy; statistical errors from more complex waveforms (in particular, actual music) have far more relevance to the human listening experience. If we choose to define non-tonal, ‘technical’ error as the sum of all headphone errors, minus the effects of tonality (once the effect of the frequency-response shift has been subtracted out), then a test can be applied to the resulting headphone output, analogous to the nulling-error test applied to DACs and digital audio players using program simulation noise or actual music test vectors. Watch this space for Part 2.
Summary
Subjective reviews have never been a very reliable way of gaining headphone impressions. This is especially true with the increasingly narrow gap between many of the better products in this overcrowded market. Notwithstanding the obvious differences in human anatomy, even the best-intentioned reviewer has a fallible human brain whose perception of sound quality is unavoidably (even if sub-consciously) altered by variables such as price, free review units, the promise of future free review units, perceived build quality, color, smell, preferred music genre, choice of test tracks, and (due to the plasticity of the human brain) what headphone and music they had acclimated to prior to the new headphone review. (We freely admit that the same large pinch of salt should be applied to any sections of our own mini/microHypes that deal with subjective perception.)
Even if we may not yet fully understand what is the optimal test to run, or how to best interpret its results, measurements are not influenced by any of the above variables, and they allow us to repeatably capture even subtle details that the sharpest human ears can’t perceive. It is simply implausible that there exists a ‘technical capability’ easily heard by a professional audiophile reviewer, yet undetectable on any microphone (including, presumably, the same microphones used to make the original recording). Test procedures and algorithms, however, need to evolve and improve, and this is work that we at HypetheSonics feel is urgently needed in order to accurately filter true technical performance from placebo and reviewer statements and claims that can’t ever be proven.