
Periodic Audio IEMs and the Technical capability of headphones - Part 2

Background 1: Low-Distortion IEMs
About one year ago, a couple of us from HypetheSonics visited Periodic Audio to meet with the owner and discuss their element-themed in-ear monitors. Periodic Audio have been involved in all manner of audio product development (you can see their existing offerings at periodicaudio.com), but we wanted specifically to talk to Periodic Audio about some unique features of their IEMs that dovetailed with our research into a headphone’s ‘technical capability’.
Most manufacturers of in-ear monitors tend to simply throw products (and frequency responses) at the wall, hoping something sticks. Periodic Audio, on the other hand, have a strong conviction about their sound signature and are (to the best of our knowledge) entirely unique in that all of their IEMs are designed – at least in theory – to have the exact same frequency response, with the differences in sound then a function of material properties such as diaphragm composition. Periodic Audio’s original Beryllium IEM also happened to measure with the lowest distortion we’d ever seen in an IEM at our standard 94 dB test level, and since the development of their original Be earbuds, Periodic Audio spent a substantial amount of time developing a co-polyester casing for their newer IEMs to damp acoustic resonances. There does appear to be a benefit to this as their new Carbon V3, with its lab-grown diamond diaphragm, is now our best-measuring IEM in terms of THD at our standard 80 dB test level. The appeal for us was that identically-tuned IEMs could form a perfect set of guinea pigs for our R&D into non-tonal sonic differences. It would be an understatement to say that the resulting rabbit hole turned out to be a little deeper than we anticipated, but it led to some interesting insight and developments that helped improve both our headphone and our DAP measurement procedures.
Background 2: A New Measurement Procedure
The measurement work described here stems from a long and fruitful history of collaboration between HypetheSonics and SoundExpert.org, and represents a natural extension of the work we’ve been doing for many years in measuring errors in portable digital audio players (DAPs) and digital to analog converters (DACs). The crux of this work is based on SoundExpert’s contribution to the audio world of the ‘Df’ or difference metric, which can be described simply as the normalized RMS waveform error (or difference) of an output time signal, compared to the original input signal. The test vector(s) used to compute these differences can, in theory, be any type of audio signal. Our usual test vector for DACs includes standard signals such as isolated sine waves (commonly used to report total harmonic distortion or THD), dual sine waves (commonly used to test for intermodulation distortion, or IMD), square waves, white noise, program simulation noise (whose spectra is designed to mimic actual music) and a mix of actual music tracks. This last and longest component of our test vector forms the most important metric as SoundExpert’s online listening tests have shown this to have a high correlation with listener preference. Although this test covers the full range of human hearing, it places a higher weight on the spectral content of actual music. The Df error from actual music tracks turns out to be one of the most difficult types of error to minimize in any electrical or electro-mechanical reproduction system. Because music tracks encompass all manner of signal type, Df error levels are typically orders of magnitude higher than those from traditionally-reported total harmonic distortion (THD) from a 1 kHz sine tone. We have long argued (and this opinion now seems to be rather widespread, despite every OEMs’ refusal to budge on the issue) that the standard metric supplied by most manufacturers – THD based on a single sine wave – is irrelevant and misleading. Almost all modern DACs are easily capable of accurately reproducing isolated sine tones, yet most are incapable of reaching the same vanishingly-small level of error with actual music.
The current state of the audio world is such that the massive imbalance in demand for DACs vs ADCs, has created a situation where no measurement equipment exists right now which is able to accurately quantify all errors in the best-available modern DACs to a level that does not include artifacts from the ADC or measurement rig itself. Fortunately, however, the relatively large errors incurred with real music test vectors makes it possible to discriminate between even the best currently-available DAPs, DACs and amps with relatively modest analog-to-digital converter equipment. Our current DAC-measurement equipment consists of a Texas Instrument PCM4222 ADC with a miniDSP USB interface, and is able to report errors lower than 80 dB below the fundamental for these complex waveforms with the best currently-available DACs. Headphone errors are of course expected to be far larger than this, but it is nevertheless still worth addressing some potential criticisms of this measurement equipment and process.
The reported Df error measures are not absolute. When measuring the best currently-available DACs, part of the reported error originates from the ADC and measurement process itself. This is the reason why our DAP/DAC databases are limited to one unique/unchanging set of measurement equipment. Absolute numbers (especially for the more accurate devices) will likely change with different measurement equipment, however overall error ranking should not (this effect can be seen in our older legacy measurement database produced with RME recording equipment). Additionally, not all errors are equally audible. A fair critique is that a larger absolute error might, for various reasons, be less audible than a smaller error of a different type. There has been some effort to address this, for example via the ‘PK’ metric in the DeltaWave null comparator tool. This tool isn’t open source and doesn’t appear to be documented, but it is free to download and use and we have been actively investigating it. There is a comment made on the DeltaWave website that is worth noting. It states: “Unlike the DF Metric proposed by Serge Smirnoff, PK Metric is not confused by small errors in timing or noise”. The Df algorithm applies time warping and shifting within small (50 or 400 ms) window samples to circumvent issues such as clock drift and allow matching signals to line-up before differences are computed, but any resulting differences in magnitude or phase are indeed considered errors, so there is a point to concede here. Certain types of signal processing, such as a pure phase rotation, could indeed result in a large Df error despite the resulting effect appearing rather benign to the listener – at least under some circumstances. A good example of this seems in the current context seems to be the Anker-Soundcore Liberty 3 Pro true-wireless Bluetooth IEM. The Liberty 3 Pro measures with huge Df errors and an outrageous impulse response which would suggest the manufacturer is intentionally applying some form of digital signal processing (DSP) – we suspect EQ and/or an attempt to widen the sound stage, even in default mode. The Liberty 3 Pro are actually good-sounding headphones, so clearly not all errors are equally bad. Nonetheless, from a purist mathematical viewpoint, one could argue that there is still an error in the waveform with respect to the original reference track, and therefore, for our first attempts at these measurements, we are using a simple mathematical RMS-based metric to assess the total waveform error. We believe this is important for the following reason: users should be free to apply their own DSP – or not – and shouldn’t have to deal with errors or transformations upstream in the audio chain that aren’t documented and/or can’t be corrected for. Phase errors might be less critical in the current (wired) two-channel IEM world where minimal or zero effort is made in regard to spatial placement of the sound (with the soundstage tending to collapse toward the center of your head), but the final frontier of two-channel audio is to reproduce the perfect three-dimensional spatial sound field with individually tailored head-related transfer functions, and in this situation upstream phase errors would be problematic as they could have significant effects on spatial perception and could be difficult or impossible to untangle. The Df error is therefore something that we ideally want to drive to zero – or at least to levels below the threshold of human hearing. Many modern DACs are fast approaching that point, and have arguably already surpassed it at modest output levels (see for example our measurements of the Shanling M0 Pro). Headphones, on the other hand, are likely to require a paradigm shift in technology to reduce error levels substantially below where they are today. One such possible path forward is suggested later.
A Df Metric Test for Headphones
In trying to develop a waveform-error test for headphones, a number of problems had to be overcome.
Firstly, the length of our original DAC test vectors was enormous – nearly 2.5 hours in total. DAPs and DACs can simply be left anywhere to record, but headphones are much more challenging. Even with the double anechoic chamber we use for testing headphones, external noise and vibrations are difficult to completely eliminate throughout entire stretches of a very long recording. Certain IEMs can also have a tendency to shift or even wriggle free from the ear simulator over time, especially when constantly stimulated with a moderately-loud signal. Very long test vectors also severely limit how many measurements you can make in any given period of time. Ideally, a shorter test vector was needed for headphones in order to eliminate external noise and vibration and placement issues during the recording period.
Secondly, headphones aren’t designed to produce a flat frequency response. In order to sound ‘normal’, or ‘realistic’, or ‘pleasing’, an in-ear monitor is typically tuned to roughly mimic the response that the external anatomy would have created, were the sound to have reached the ear in the manner nature intended. There seems to be two main reasons why evolution left us all with pinna – our external ear anatomy amplifies sound (though not uniformly across all frequencies), and also reflects sound both vertically and horizontally into the ear canal. Amplitude differences between left and right ear can assist with horizontal placement, but vertical placement and distancing relies on timing differences from those pinna reflections. Our brains are used to processing the resulting phase and magnitude responses, but once an ear canal is blocked, that physical mechanism is by-passed and must be simulated by an IEM in order to trick the brain into thinking it’s hearing ‘normal’ sound – that is, sound that has reached the brain in the traditional way we’ve heard all our lives. The most important effect the IEM needs to replicate here is the tonal shift, which immediately causes the signal to depart from that of the source or reference track.
Thirdly, the use of a coupler or in-ear simulator adds its own modulation to the sound received at the virtual eardrum in the same way a real ear would – i.e., the amplitude and phase of the original wave is further altered by the specific transfer impedance response of the ear or ear simulator.
The first part of our work involved developing a new, compressed set of test tracks. The result of this initial work was a new, shorter, combined test vector, less than 15 minutes in total, that incorporated a mix of music (rock, jazz, folk, EDM, classical) along with various standard test signals. That same combined test vector is now being used for both our headphone and DAC tests. The observant HypetheSonics’ reader might have noted that our updated test vector now includes some high-resolution (96 kHz/24-bit) test signals. There is one important comment to make about these: our tests only include errors in the audible frequency range (20 Hz – 20 kHz). The fact that some digital audio devices give improved reproduction with hi-res signals while others don’t is mainly caused by differences in these devices’ anti-aliasing filters when switching sample rates; in some devices, the change in antialiasing filter directly impacts frequencies below 20 kHz. Despite the much-shorter duration, our new test vector is able to almost perfectly reproduce the time-averaged statistical results of the original (2.5 hour) test vector on digital audio players. Our hypothesis is therefore that these output statistics should correlate well with all forms of modern music.
To EQ or not to EQ, that is the Question
While DACs and amps are, or arguably should be, designed to reproduce the original signal with zero coloration or deviation from a perfectly-flat frequency response, the same is not true for headphones. For the reasons discussed above, some change in headphone tonality (with respect to the flat reference signal) is normal and expected. This creates a dilemma for a headphone Df error test, since the output of any modern headphone (even one whose response is closely tuned to some idealized preference target) would never null against the flat reference waveform.
The perfect solution to this problem isn’t something we’ve yet reached a firm consensus on, even internally. Some of us at HypetheSonics feel that headphone waveform error should simply be measured as is, with magnitude degradation being attributed as tonal error and phase degradation being attributed as any remaining (non-tonal) error. This would, however, appear to cause an obvious bias with an inherent increase in error as the headphone’s tonality departs from a flat response, which must happen (to some degree) for all headphones. Other thoughts at HypetheSonics are that we ought to first attempt to correct for the frequency response of the headphone, especially since the concept of ‘technical performance’ indicates this metric ought to be independent of frequency response. Although a headphone’s frequency response (amplitude vs frequency) is the curve most people obsess over, there are a number of reasons to believe its importance may be waning, and why, therefore, we would want to try to remove that aspect from this test.
Firstly, the plasticity of the human brain means that we can learn to accept a modest shift in tonality as sounding completely normal after a certain period of time. Secondly, most headphone manufacturers now understand roughly what type of tuning appeals to a mainstream audience, and in the last decade the spread in headphone tuning appears to be narrowing, with many headphones closing in on something vaguely resembling the Harman target. In other words, differences in tonality are becoming much more modest, and therefore our brains can more easily accept such changes. Much of the variance around current headphone tuning seems, in our opinion, to be more a form of correction for equal loudness to satisfy users with different listening-volume preferences. (In fact, some manufacturers, such as Bose and Apple, now adjust their Bluetooth headphones’ FR as a function of listening volume to account for this.) As differences in headphone tuning (for a given SPL) become smaller, characteristics such as fit, comfort, build quality, design aesthetics, price, marketing and any other (non-tonal-related) reproduction errors will inevitably become more important discriminating factors. This is especially the case if we consider one other factor – good-quality parametric equalization is now widely available in many Android devices (via UAPP or Wavelet), and even on iOS devices via Bluetooth dongles, such as the Qudelix-5k. At some point, high-quality parametric equalization may even become a standard feature of true-wireless earbuds. Automatic EQ tools on websites such as HypetheSonics now make it very easy to generate the output coefficients needed to equalize one headphone to nearly perfectly match any other headphone’s response, any existing target, or even to a completely new target (for example, HypetheSonics’ MC or ‘Modifiable Copy’ feature lets you interactively drag and draw to modify any existing FR target for equalization). For all these reasons, it seems that headphone tuning may not continue being the massive discriminating factor it was just a few years ago.
Whether or not we are correct about the diminishing significance of amplitude versus frequency curves, we already have metrics available to score any departure from a given target frequency response, and so we don’t need a new test to reproduce that same effect. Target curves themselves are also not really universal – even for a single individual, who might tomorrow decide to listen to some new music with a very different spectral content. The only curve that isn’t arbitrary is the flat response curve of the reference track, and this can be corrected for by perfectly inverting the frequency response curve of the headphone measurement during the same recording session (without moving the headphone in the coupler). The goal is then to look for the error around the headphone’s mean response. However, ultimately it seems that these two positions (to EQ or not to EQ) might not be as different as they first appeared – at least in terms of the error metrics that emerge from current headphones.
To help answer some of these question about the use of equalization in these headphone error tests, we studied the effect of the total waveform error (Wf), along with the isolated magnitude (Mg) and phase (Ph) errors using a set of representative headphones, which included Periodic Audio’s dynamic driver IEMs, balanced armature, hybrid and electrostatic in-ear monitors. We consider this set to be representative of all existing in-ear monitors since planar magnetic and dynamic drivers tend to have very similar characteristics (with comparably low 2nd-order dominated harmonic distortion) and xMEM drivers (and estat drivers) tend to have characteristics very similar to that of balanced armature (with comparably large, 3rd-order dominated harmonic distortion). We looked at various correlations with the raw waveform measured directly from the headphone and also with a minimum phase equalization applied to that waveform in order to revert the output to a perfectly flat frequency response. We also included theoretical tests by simply equalizing the reference track to mimic a specific headphone in order to compare errors that arise purely from an idealized tonal shift with those of the headphone itself. The ear simulator used for the headphone recordings was the GRAS RA0045, but beyond the quality of the 40AO microphone, the coupler is not considered critical since determination of the frequency response is not the goal here and any modification to the frequency response would also be accounted for with any applied EQ.
The recorded output is processed in 400 ms time slices and errors accumulated into a histogram, showing normalized occurrence on the y axis and the error in decibels (below full scale) on the x axis. Some example outputs are show below:
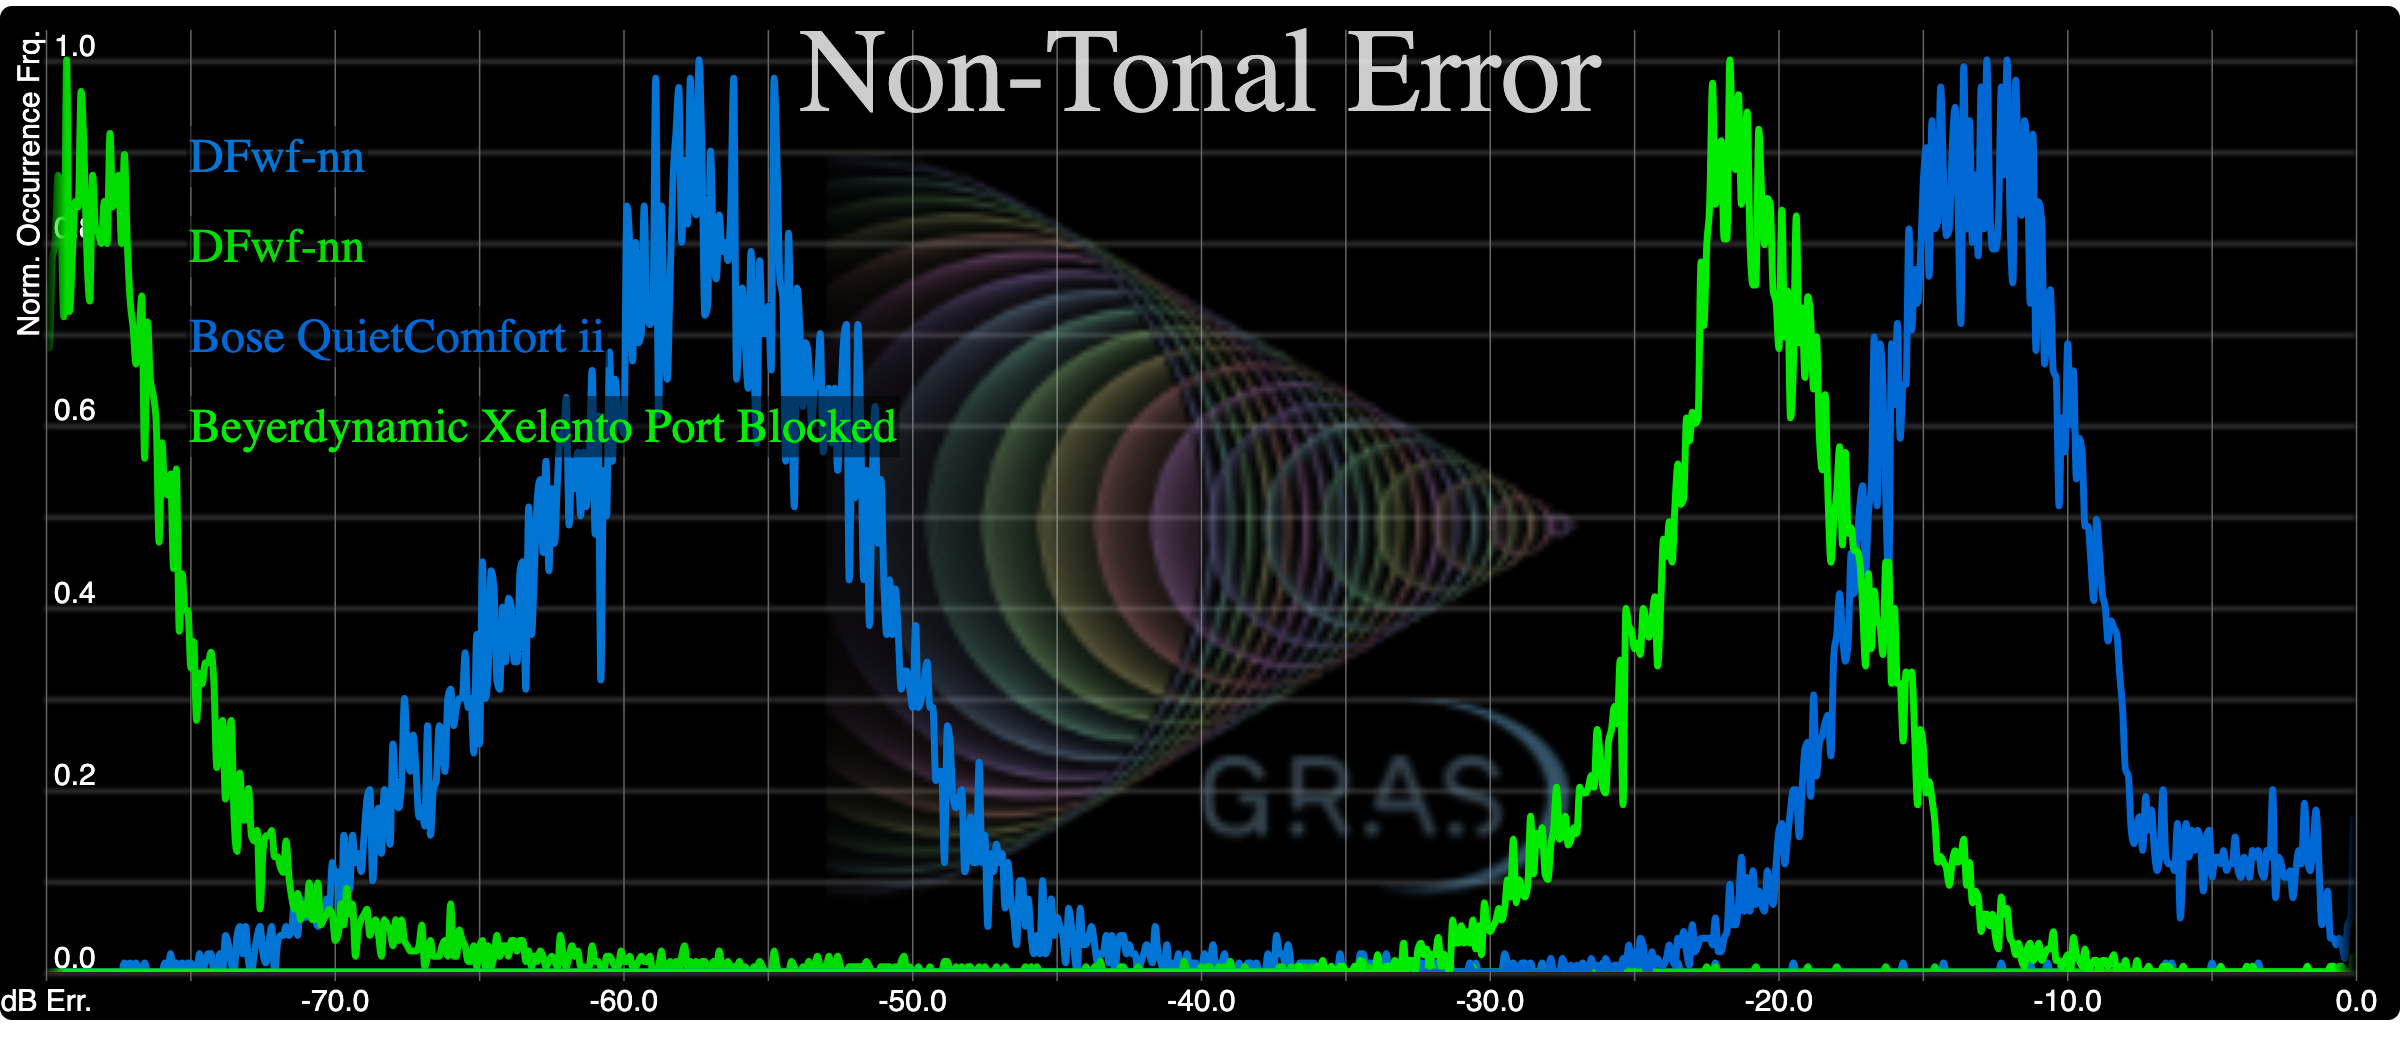
A perfectly accurate reproduction with zero error would result in a histogram to the very far left (in theory, a histogram median dB error of minus infinity). The farther the histogram curve moves to the right, the higher the error. The above figure shows two sets of results. The two curves toward the right are the EQ-corrected errors based on the recordings of two headphones (the Beyerdynamic Xelento with its ports blocked and the Bose QuietComfort ii). The two curves to the left (the color-match DFwf-nn curves) are the errors from the original reference track equalized to match the measured frequency response of the respective headphones, which are shown below:
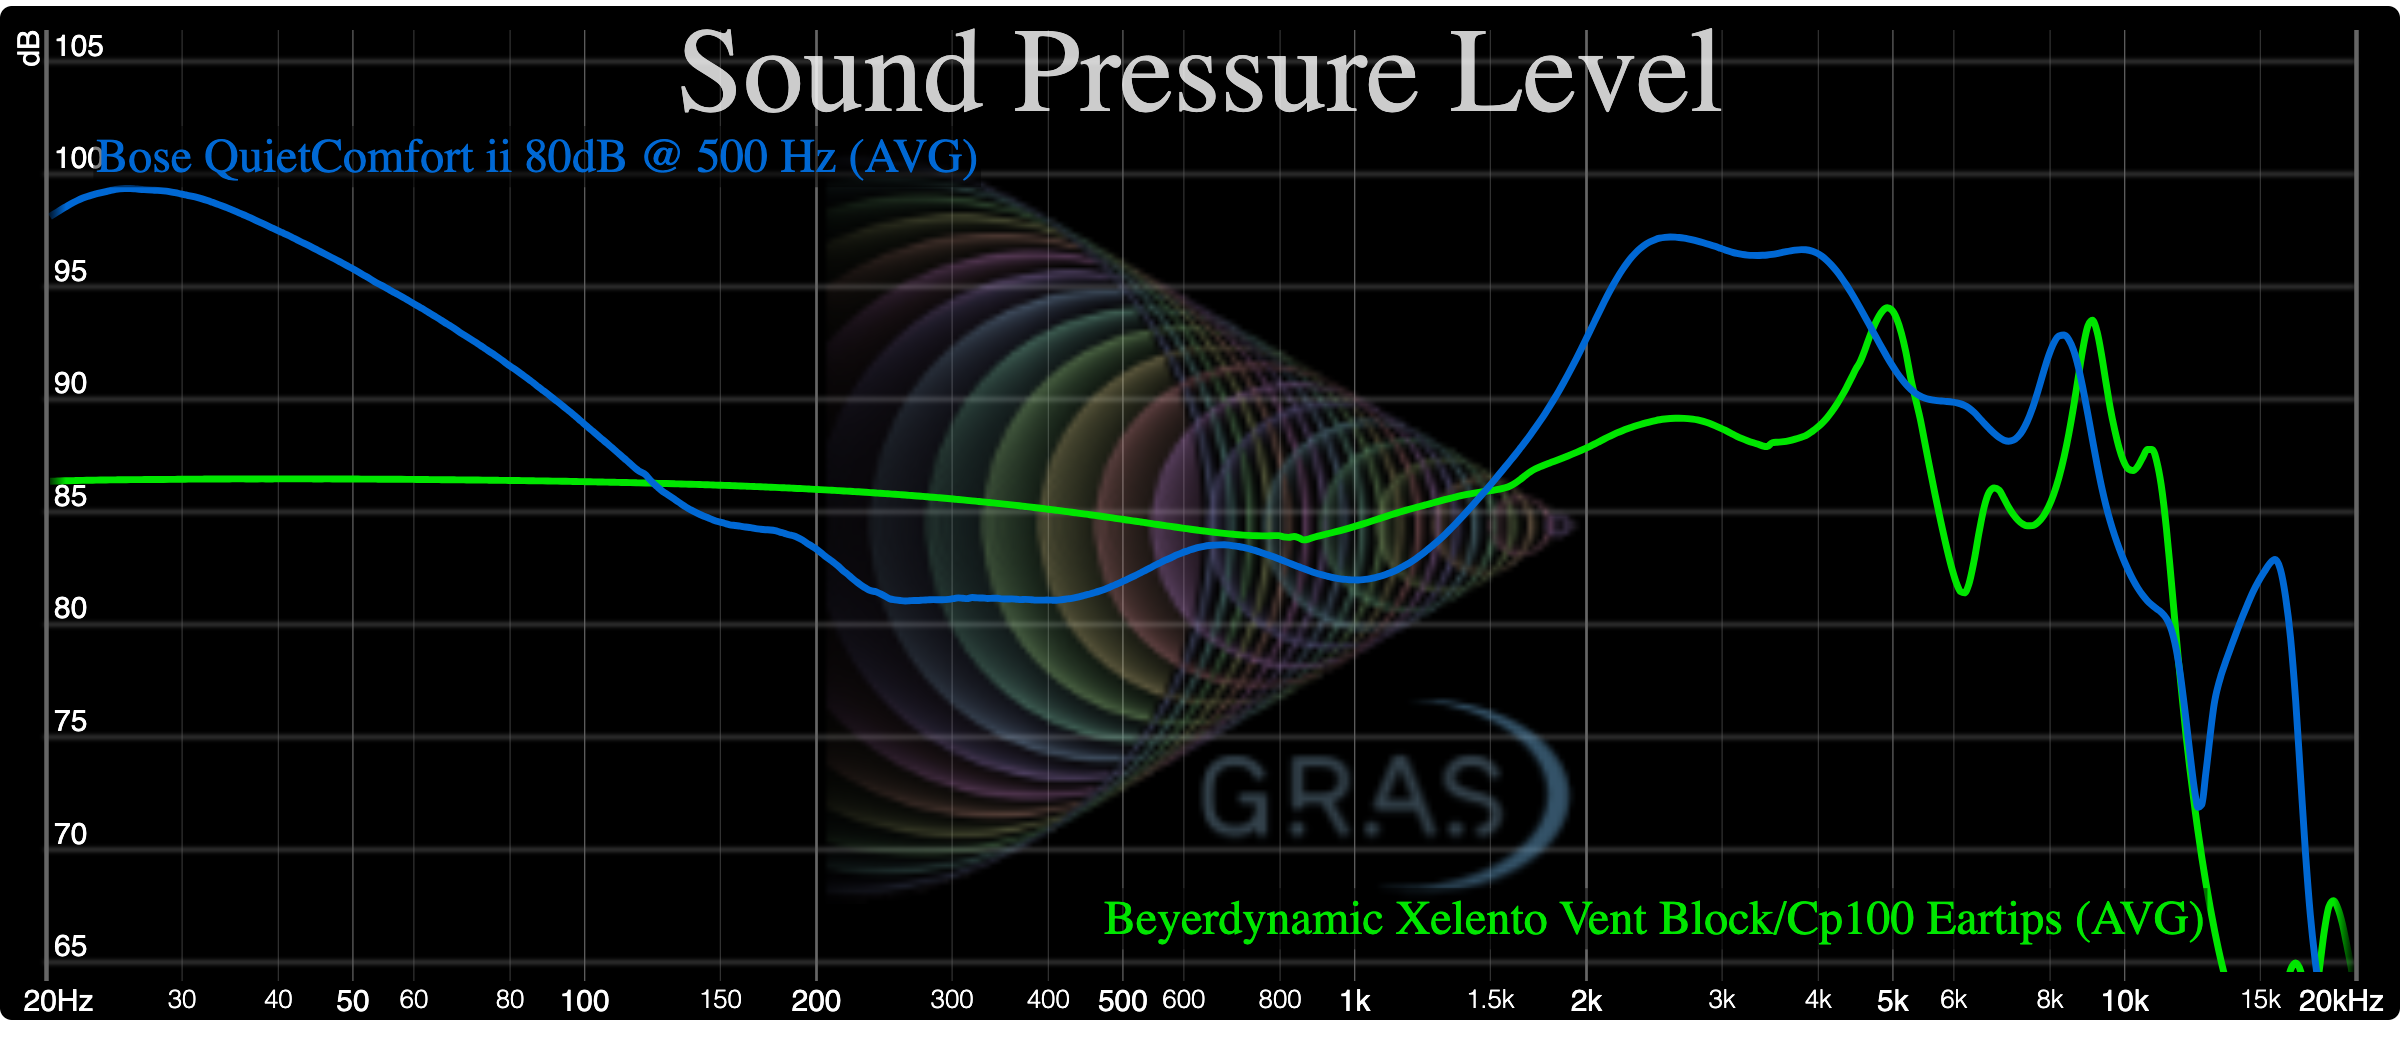
The measured Df errors are actually more consistent and repeatable than those of frequency response. The latter can vary significantly with insertion depth, ear-tip type, etc., but such use-case changes have less of an impact on the Df error.
The equalization process was ultimately built into a Matlab script, with the frequency response taken directly from the same headphone recording. Earlier tests were conducted with Audacity’s filter-curve EQ and, although slower to process, was found to give virtually identical results. (For those that are interested, an Audacity 200-point B-spline filter-EQ coefficient curve can be downloaded for any given frequency response curve on our databases by typing ‘ldownloadfilter’ or ‘rdownloadfilter’ in the IEM graphing tool for the currently-selected headphone’s left or right channels, respectively.)
As expected, the process of doing nothing more than applying equalization to the reference waveform already results in an error. Note, however, that the error obtained from the actual headphone output is, in each case, on the order of 60 dB worse than this. While the amplitude and phase shifts caused by the headphone’s tonality form an inherent part of the error, there appears to be a much larger error coming from the headphone’s driver and housing (in fact, from the entire measurement chain, but, again, all other hardware and software aspects of the measurement process are constant across all headphones). We have termed this measure total ‘Non-Tonal Error’, or NTE for short. Our currently-measured headphone NTE levels are far larger than even the largest total harmonic distortion levels we’ve observed in any IEM. The median Df error level (the decibel level at which half the error is below and half above) of the total non-tonal error ranges from roughly -5 dB to -20 dB for all headphones tested to date.
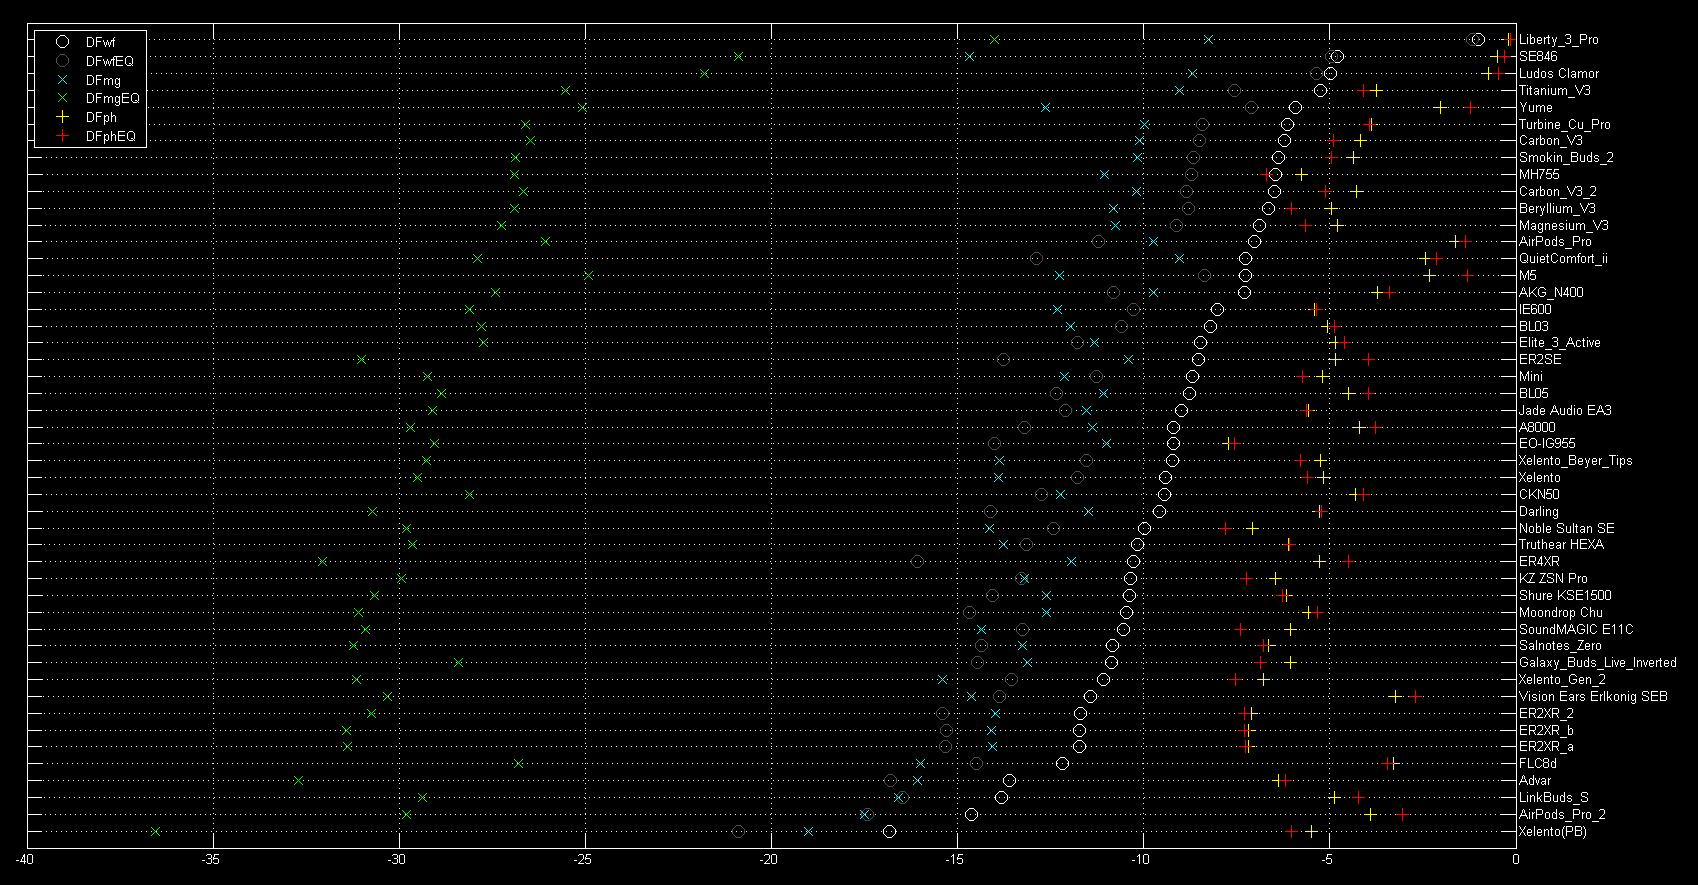
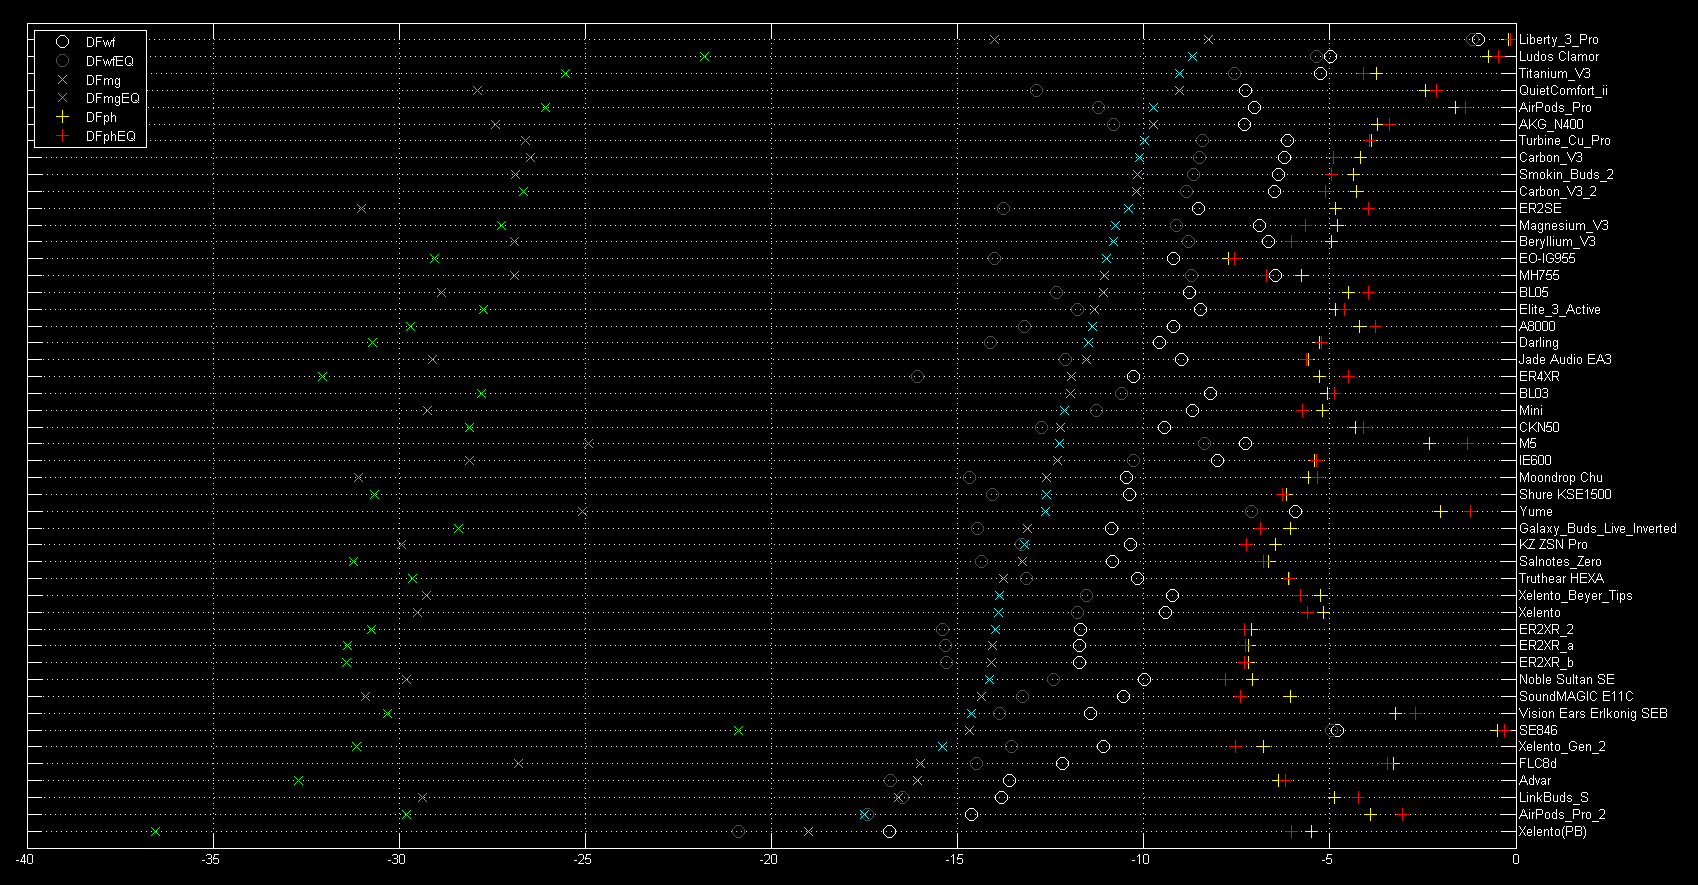
The figure below shows the results from our set of test IEMs, ranked by the total waveform error of the raw headphone output (DFwf):
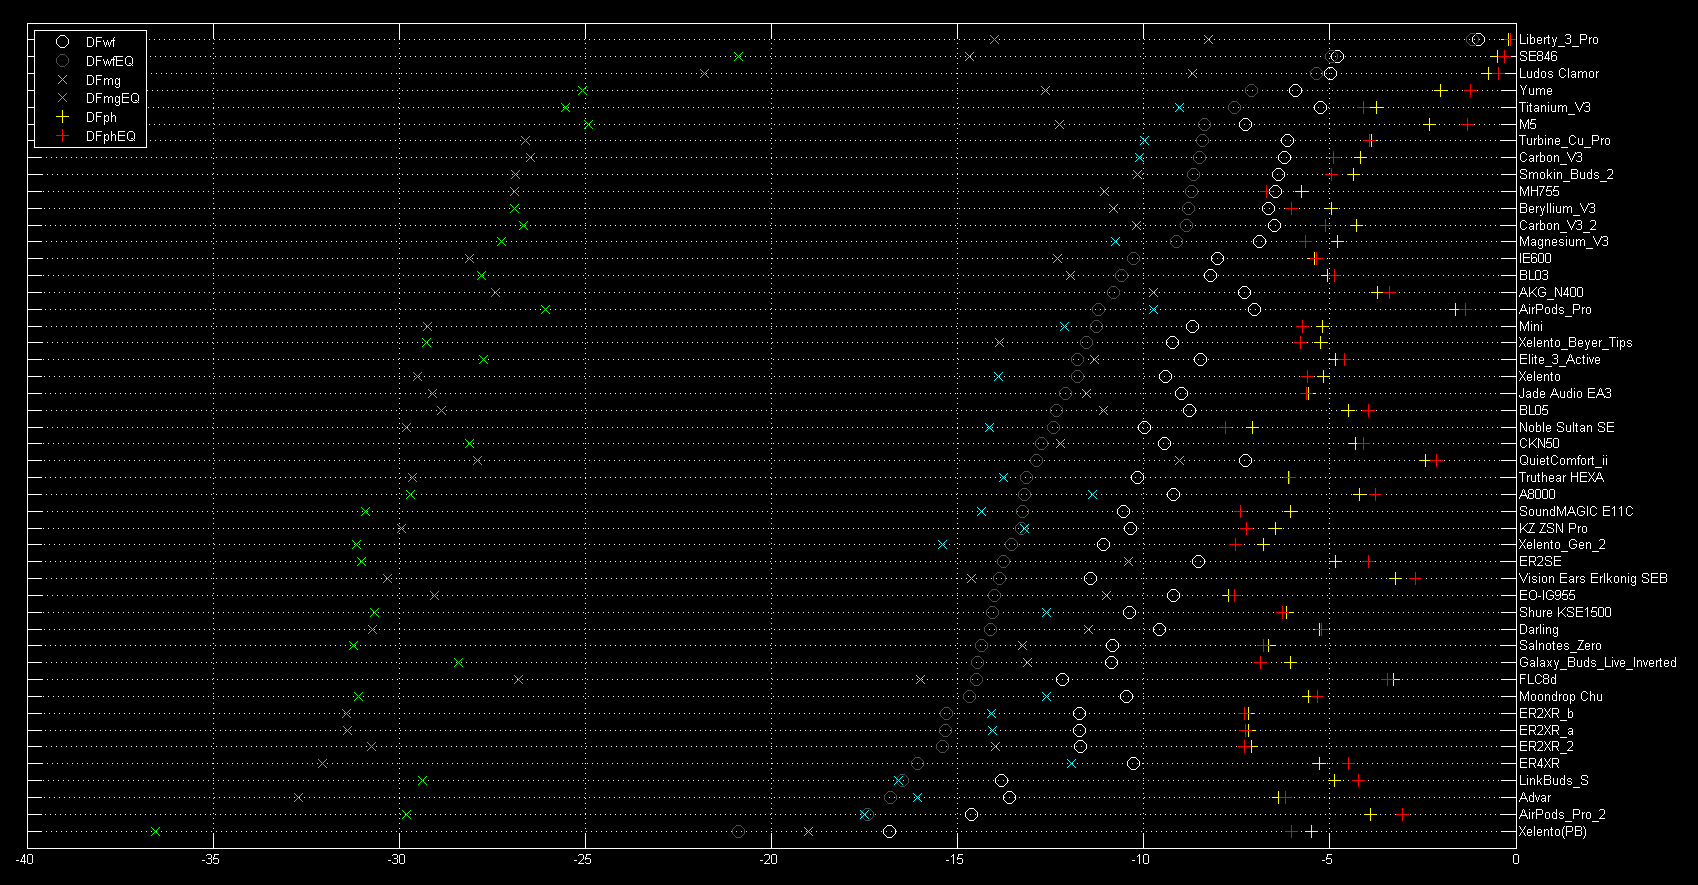
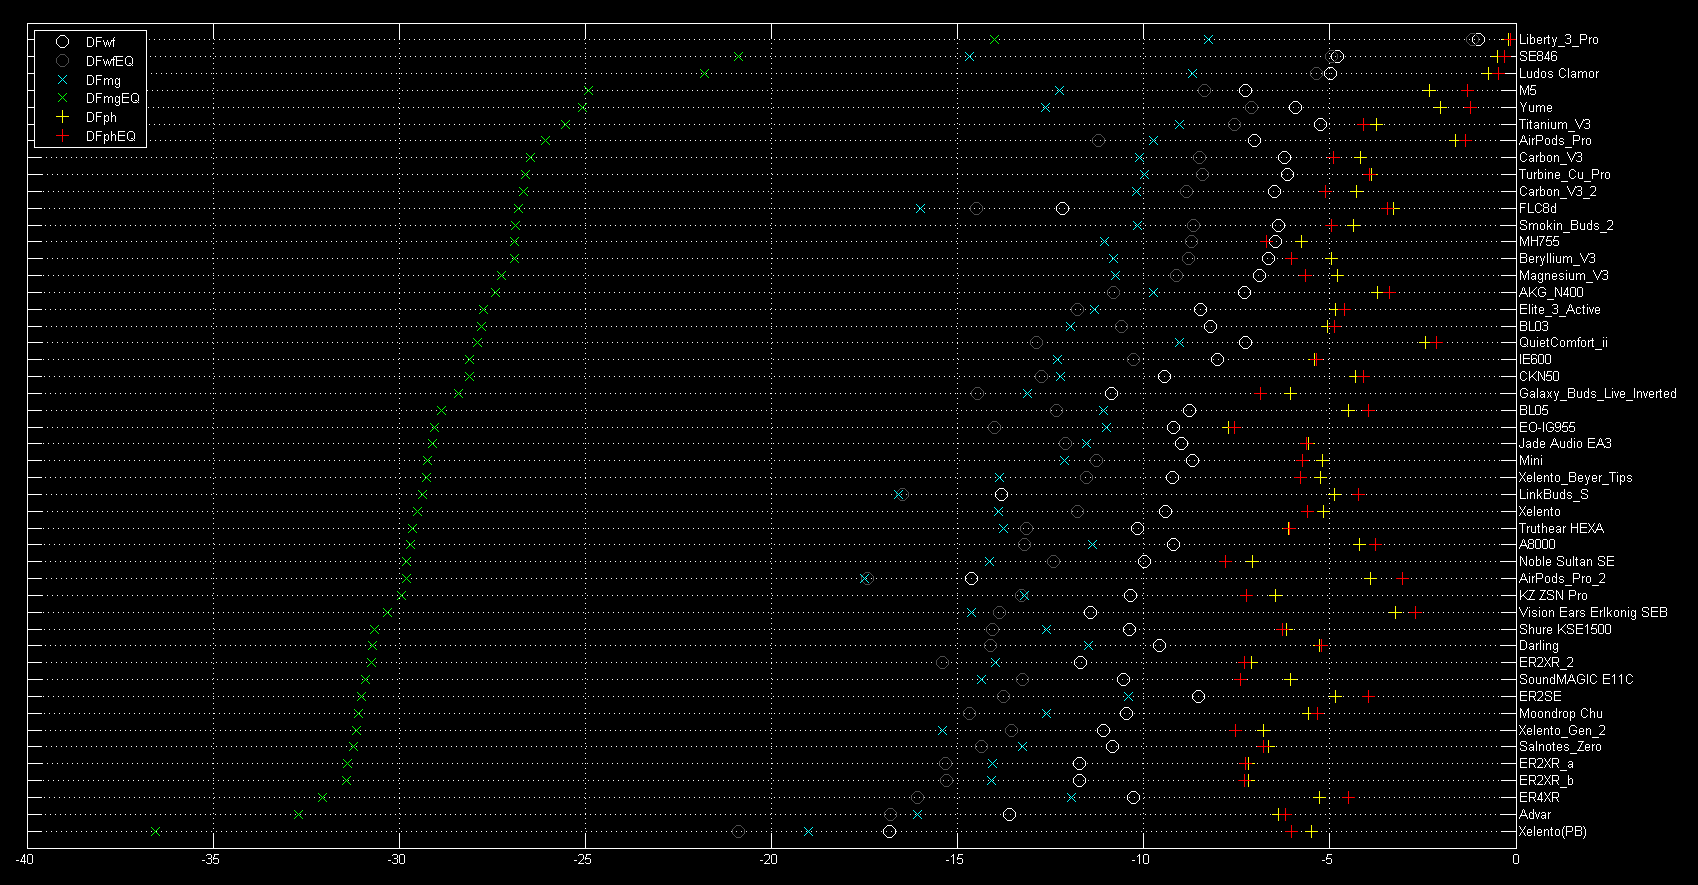
The following figure shows the exact same data, but this time ranked by the EQ-corrected waveform error (DFwfEQ):
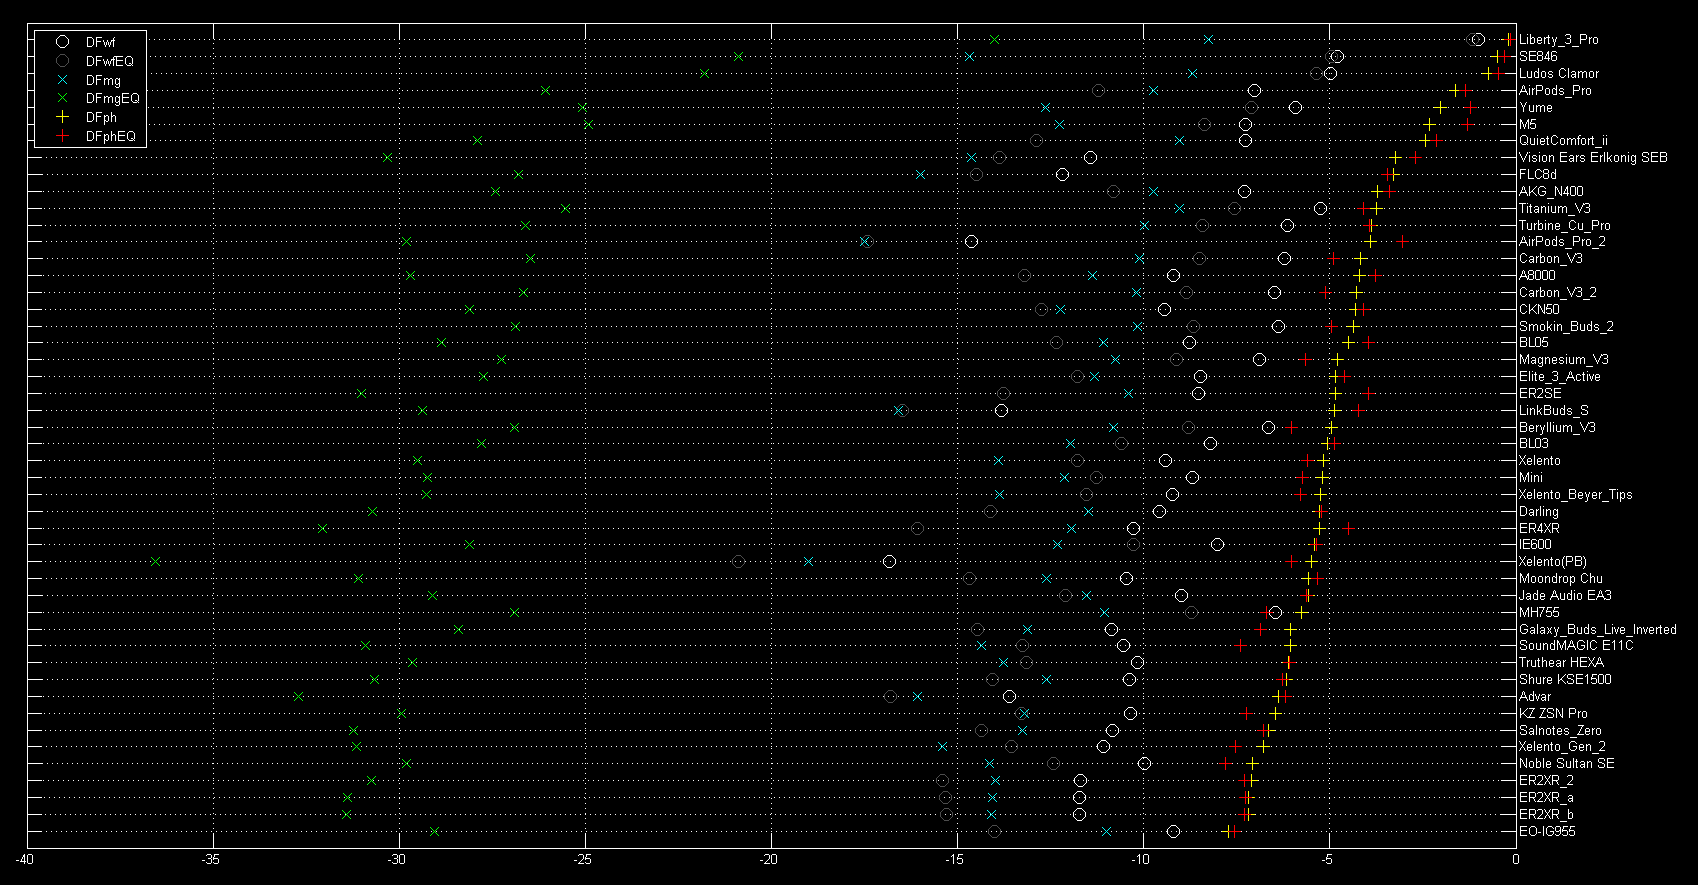
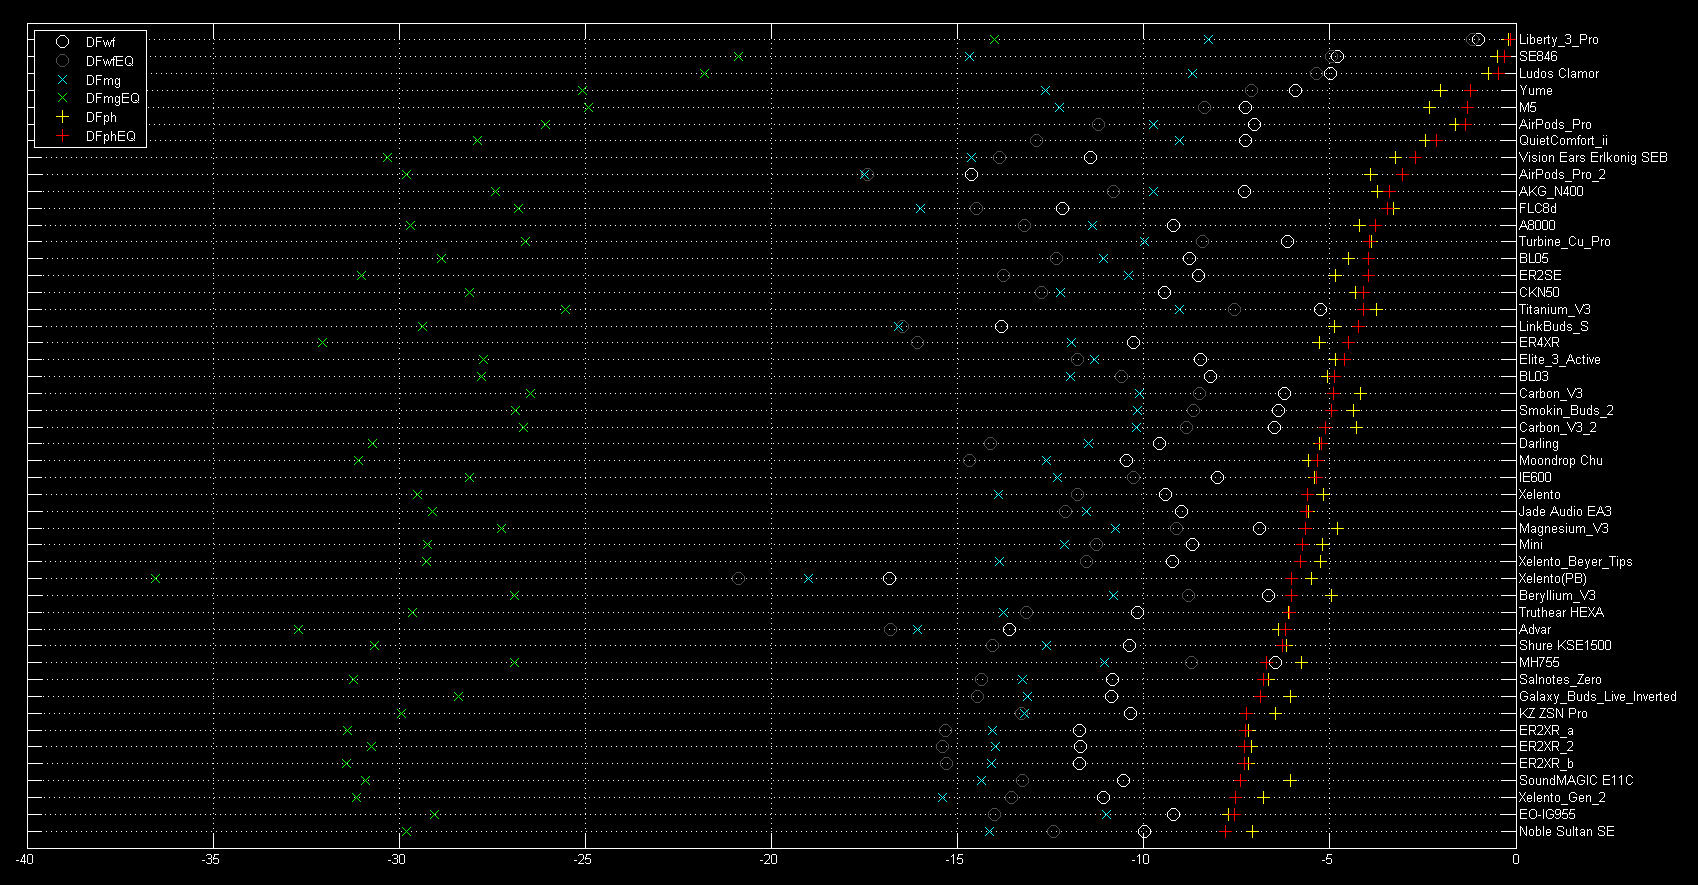
The following two figures show the same for the magnitude degradation (ranked first with no EQ and then with EQ):
The following two figures show the same for the phase degradation (ranked first with no EQ and then with EQ):
Although our current NTE database does include this minimum phase equalization correction based on the FR obtained for that headphone during the capture of the recorded test vectors, the results above show that the effect of this EQ is smaller than one might have expected, and that some level of error remains an intrinsic function of initial frequency response, even if an EQ correction is included.
There are some interesting surprises in these rank positions. For example, the Etymotic ER4XR scores rather well considering it’s a BA-based IEM with relatively high distortion. The FLC8d also scores well, considering this is a multi-driver IEM which includes BA drivers. Periodic Audio’s IEMs, despite their very low harmonic distortion, don’t actually score quite as well in terms of NTE. The Shure SE846 and SeeAudio Yume IEMs score quite poorly on account of their large phase errors. Note that there are other headphones with very similar FR to that of the Yume (for example, Apple’s AirPods 2 Pro and the 7 Hz Salnotes Zero) and other headphones with very similar FR to that of the SE846 (for example, the Meze Audio Advar) that in each case have much lower NTE.
The following table shows the correlations between the various metrics, with and without EQ. This shows a 0.95 correlation coefficient between the total waveform error with and without EQ (DFwfEQ and DFwf):

Equalized and non-equalized phase degradation are strongly correlated, suggesting this is essentially one and the same parameter characterizing the headphone’s phase accuracy. There is further indirect evidence of the inability of our EQ filter to fully compensate for the headphone’s response. In general, magnitude and phase are only weakly correlated. In our headphone test set, the correlation between Mg and Ph degradation (without EQ) is 0.38. After applying our EQ filter the correlation increases to a fairly significant 0.68. Consequently, the usefulness of the compensating EQ is somewhat less that might have been anticipated.
The following figure shows the test headphone set graphed with the Df median error on the y axis and the Harman score – with respect to the Harman target – on the x axis:
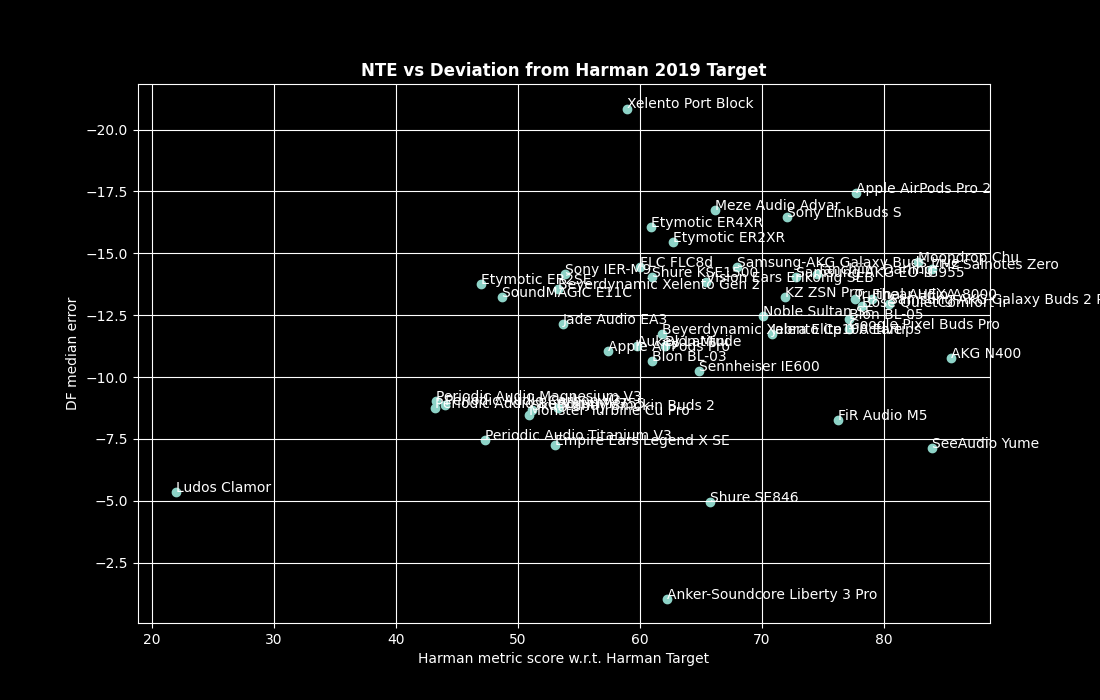
Pearson’s correlation coefficient for NTE vs a Harman metric score based on the Harman target is only 0.33 – not zero, but pretty weak. To reiterate the comment made earlier – we consider no preference target to be truly universal and in this context the Harman target should be considered as an essentially arbitrary FR curve for which we shouldn’t have expected a high degree of correlation with headphone NTE.
However, the following figure shows the headphone set graphed with the Df median error on the y axis and the Harman score with respect to a perfectly flat frequency-response target on the x axis:
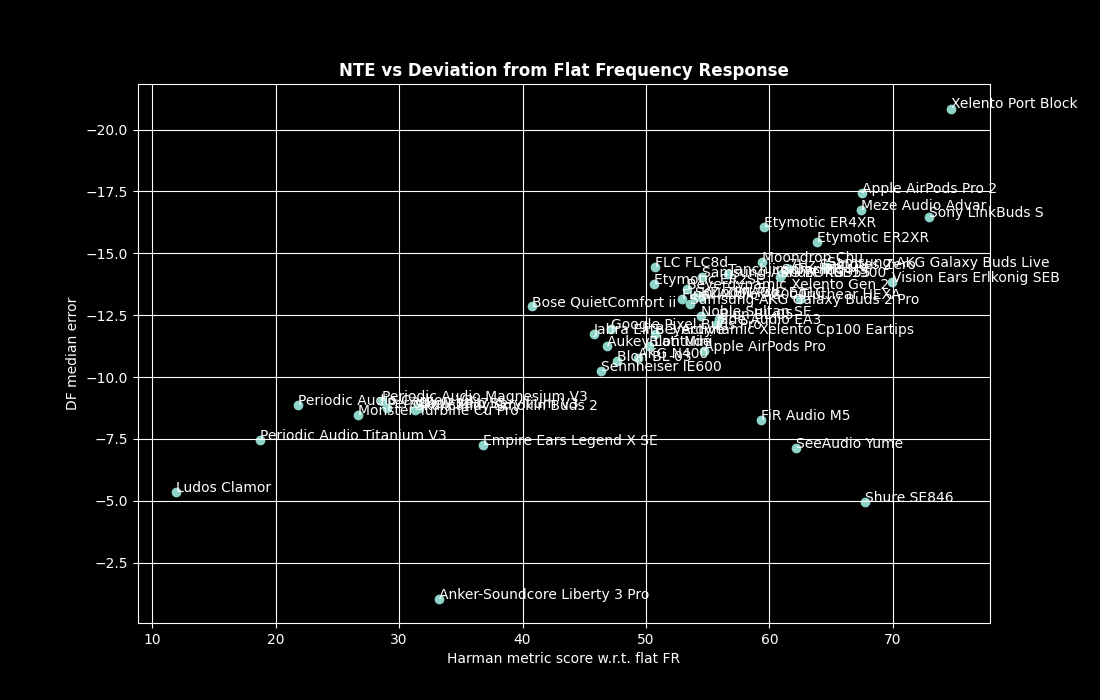
Pearson’s correlation coefficient is now 0.68, indicating we clearly have a correlation. In particular – it seems there is some common physical constraint, i.e., there aren’t any headphones in the top left quadrant. Creating such a headphone is likely to require a paradigm shift in headphone technology. On the other hand, it’s obviously quite possible to construct a bad headphone that (intentionally or otherwise) exacerbates magnitude and (in particular) phase errors. These outliers occur only in the bottom right quadrant of the graph. If we remove the four main outliers, Pearson’s correlation coefficient jumps to 0.9, which indicates a very strong positive linear correlation.
The above shows that, perhaps not entirely unexpectedly, the flatter the original headphone frequency response, the lower the phase degradation. As mentioned earlier, phase accuracy is important for correct spatial positioning of the sound, but this can be a relatively small impact of phase, and not necessarily all that important in wired two-channel audio where little or no attempt to made to reproduce an accurate sound stage anyway. What is potentially more significant is that severe phase errors could completely alter a waveform. All this suggests that, with existing off-the-shelf technology, it should be possible to design a headphone that would outperform most or all models currently on the market. Ideally, the combined effect of a headphone’s transducer and housing should give a reasonably flat response with minimal phase error and the required tonal shaping should be created mostly via software (DSP). It is possible to crudely test this hypothesis with existing headphones. For example, take two headphones – one with excellent phase accuracy and the other with large phase errors. Then use equalization to make their frequency responses identical, or as close as possible to one another, given the caveats of canal-dependent resonant frequencies and other insertion and anatomy-related issues. Similarly-shaped headphones can help to add a pseudo-blind element to such a test.
You Get What You Pay For – Or Do You?
The following might not come as a surprise to audiophile skeptics. In the graph below, the x axis data is replaced with the headphone’s MSRP in US dollars at launch:
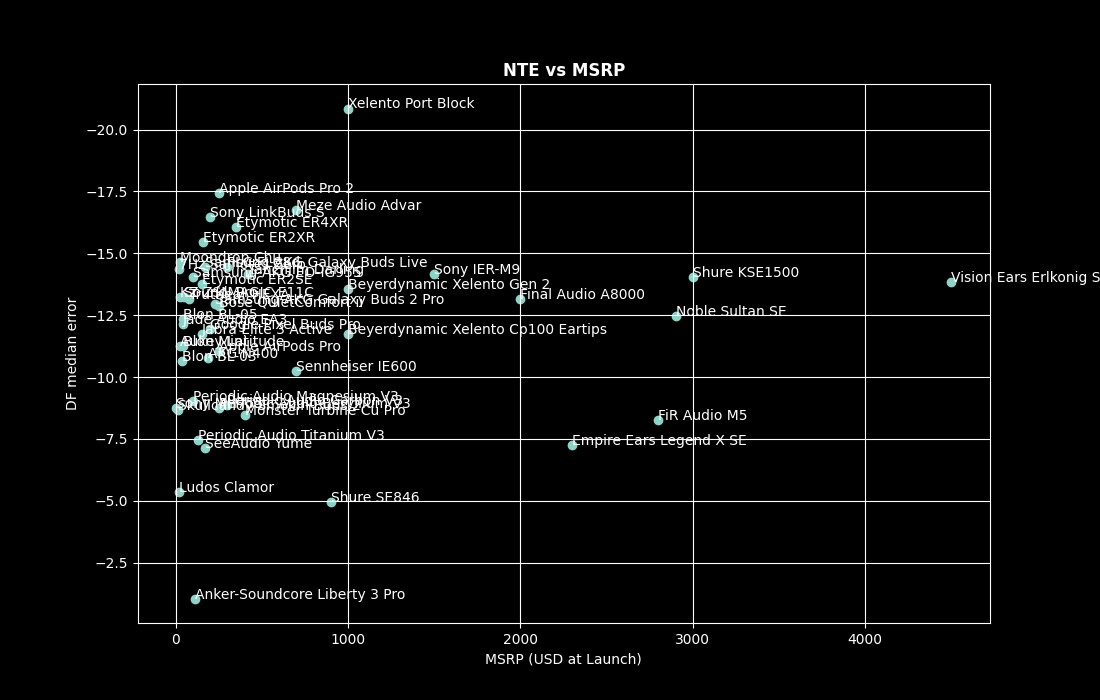
Pearson’s correlation coefficient for NTE vs manufacturer’s suggested retail price is 0.07 – essentially no correlation at all.
Summary
There’s compelling evidence that headphones do indeed have a ‘technical capability’ – that is, they display a varying level of magnitude and phase error which is present at levels far more significant than that of harmonic distortion. We have named this ‘total non-tonal error’, or NTE for short. Despite the name and intent of the test, it appears that a headphone’s NTE is correlated with how smooth the headphone’s frequency response is – in particular, its departure from a flat frequency response. This is true with or without a minimum phase equalization correction to the waveform, likely because, regardless of the driver quality, certain phase errors simply cannot be untangled via DSP. This suggests that all headphones would benefit from a frequency response that avoids wild peaks and troughs in its amplitude vs frequency curve. This also alludes to the possibility of improved accuracy in future headphone design by more reliance on DSP for adjusting amplitude and phase, and less reliance on sound shaping via driver crossovers, dampers and resonance chambers. Further work would be needed to see if there is indeed a correlation between NTE and the various YouTube reviews that regularly tout headphone features such as ‘technical capability’. Incorporating psychoacoustic effects is likely a necessary next step given the size of the errors originating from existing headphone playback. Assigning any ‘technical capability’ score without verifiable and repeatable measurements and some demonstration of listener preference would run the risk of this being used (intentionally or otherwise) to hype overpriced, poorly-tuned products. Controlled studies would be needed to avoid placebo and other psychological influences on subjective reviews. Consequently, we would urge that our existing NTE database be considered as a beta feature and viewed with caution. A poor NTE score could definitely indicate a problem, but it could also indicate a phase error that might not be all that bothersome. Finally, as the Harman research group pointed out years ago with frequency response, non-tonal error also appears to have no correlation with the manufacturer’s suggested retail price.
—————————————————
Did You Know?
All products on our databases come with a ‘microHype’ – brief subjective thoughts and impressions on the product and its ranking. To access the DAP microHypes, simply click on the slide for that DAP. To access the microHype for a headphone, click on the name of the heaphone once displayed, or click on the (red) score in any rank/search result. Certain products that are regarded as special, or particularly relevant or interesting, have more extensive reviews in the form of ‘miniHypes’. The latest miniHype is always displayed on HypetheSonic’s front page, with archived miniHypes shown below.